

The box shows where half the data live, with a line dividing the boxes marking the median. The small black square in the mean, and the little crosses show highest and lowest data points.
When I submitted the manuscript, I didn’t do any statistical analysis of the data. One reviewer asked me to to a statistical analysis. It was a perfectly reasonable request that I should have anticipated. The reviewer didn’t see the same plot that I have above and didn’t know the data as well as I do.
But it got me thinking. John Vokey, one of my undergraduate professors at the University of Lethbridge,used to refer to some differences as “significant by the IOT test.” IOT was an acronym for “Inter Ocular Test.” In other words, the difference was so bloody obvious that it hit you right between the eyes.
“If the mean for one group is up here with only a little variation, and the mean for the other group is down here with this much variation, what do you need a test for? Why not just say they’re different?”
I didn’t do an analysis because I thought there was no point. In the data above, there is no overlap between the two sets at all. Do you need a statistical test to tell you that those two data sets are different?
It is easy enough to do a simple t-test on the data above.

But does adding the test and p value tell you anything more, or different, than the plot alone? Or is including the p value a statistical “fig leaf”?
Do your thoughts about analysis change when I plot the raw data next to the box plot?
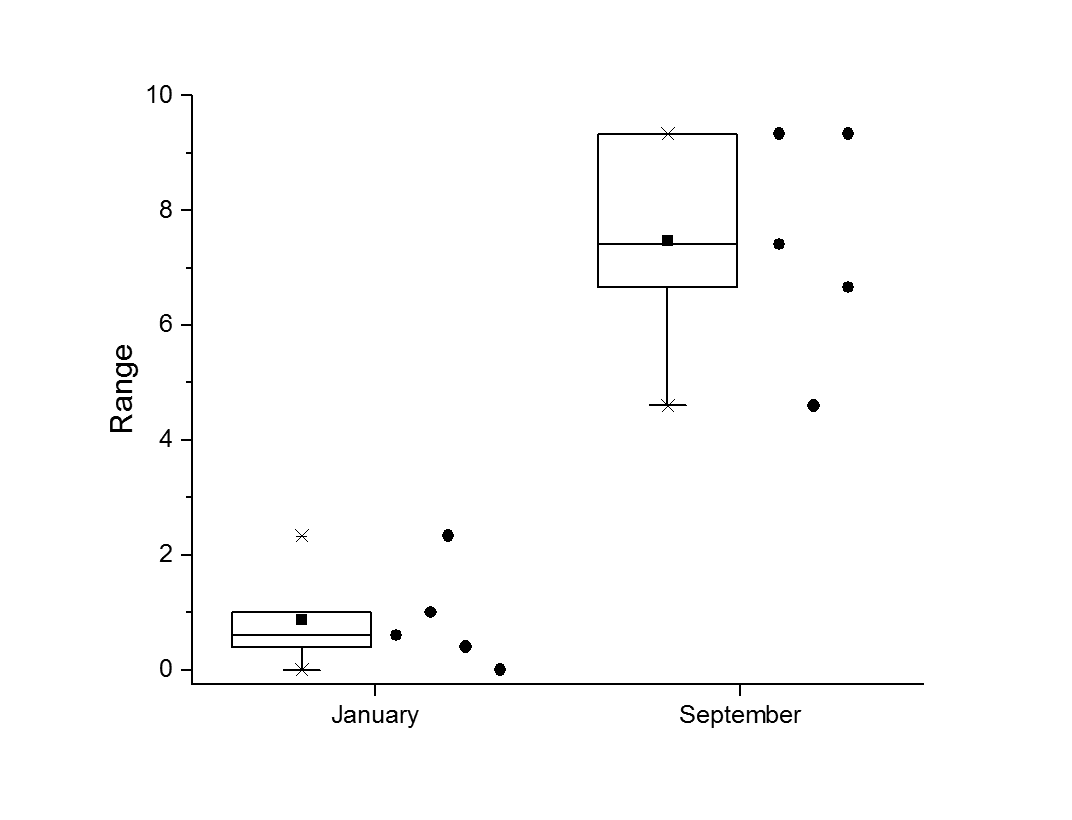
Now you can see more clearly that the sample size is small. But even then, when there is no overlap in the data sets, is there any test or condition that will say those two are not statistically different?
3 comments:
I guess I'd say "yes, you do need a statistical test" - and your point about sample size is a good one. Now, depending what those error bars are, most experienced scientists can basically do the test in their heads looking at your plots. So I'd argue that you actually had done one; you just hadn't formalized it. I call the test you did the "O test" (in analogy to the t, F, and G tests; except that "O" stands for "obvious".
The problem, of course, is that while your intuition was totally correct with that dataset, it won't necessarily be when the data are noisier. Humans are really, really good at extracting pattern from data sets that don't actually have any - hence the face on Mars, etc etc. That's why we invented inferential stats to start with!
So I side with your reviewer, even though in this particular case I also side with you (!) that the answer is pretty obvious.
This is a topic I discuss with my biostats students: why do we even perform statistical tests? In a case like yours, I think that the more important thing is the difference in the magnitude of the differences, rather than a test of whether or not they have the same means. I would have asked for effect size statistics rather than a t-test (or both, for good measure) that would have focused on the biological differences, rather than the statistical differences.
In my opinion the p-value from the t-test, by itself, actually detracts from the analysis, in that it brings a new assumption of normality that may or may not be supported by the data. (It is pretty hard to talk about normality for so few data points & you could certainly use nonparmetric alternatives to the t-test, but that is another story). I think Tristan basically has it right that the question of whether the difference in means is "statistically significant" misses the point. But other questions which really do require statistics, like effect size, might be more interesting (but of course it depends on what you are using the data for).
Post a Comment